Operations and accounts system for plastic and rubber factories
Track materials, mixes, and production orders, and know waste volume and the cost of every run.


Follow plastic and rubber production and know the cost of every run
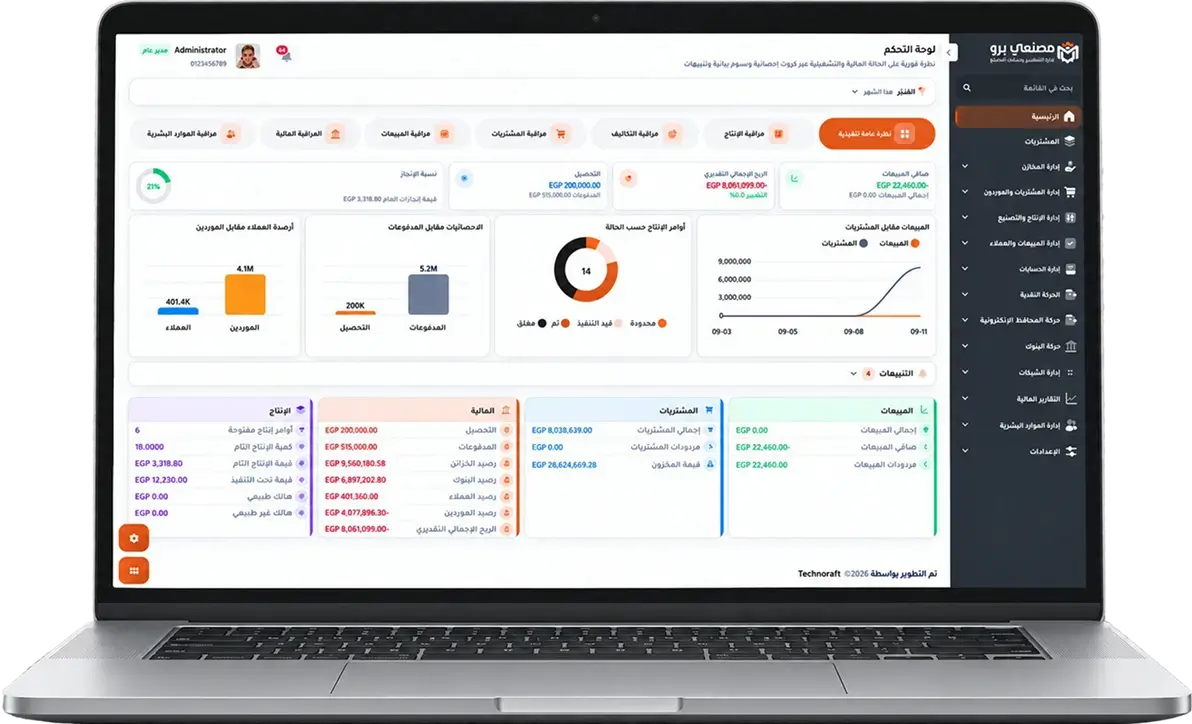
Connect materials, mixes, production orders, produced quantities, and rejects inside Masna3y Pro to know what was consumed and what actually came out of the run.
-
1Follow mix components and consumption.
-
2Clear good and rejected quantities.
-
3Compare planned and actual run cost.



We understand mixing, forming, and waste challenges inside your factory.
Changing material ratios, molds, and reject rates can make the same product leave each run at a different cost.

Mix consumption variances
It is hard to explain why material and additive use differs from the quantities set for production.

Mold and setup changes
Orders can overlap or get delayed when molds change and the run is being prepared.

Unclear rejects and returns
Recording rejected product and materials returned to the run separately confuses quantity follow-up.

Variable cost per run
The effect of waste, rejects, and operating expenses on product cost is not easy to see.
See how Masna3y Pro handles your factory challenges inside the system
Every stage in your factory becomes clearer when materials, operations, production, waste, and cost are connected in one platform.
- Uniform and connected data.
- More transparent actual cost.
- Real-time reports that help management decide.
Production order reports
Track planned, in-progress, completed, and delayed orders, with required, executed, and remaining quantities.
Material consumption reports
Compare standard recipe quantities with issued and actually consumed quantities.
Batch and expiry reports
Follow batch movements and quantities with production and expiry dates and inventory status.
Quality reports
Show inspection results for materials, production, and finished goods, with accepted, rejected, and rejection reasons.
Waste reports
Know waste quantity, percentage, causes, stage, and impact on operations and cost.
Actual cost reports
Compare planned and actual cost per product or production order and identify variance sources.
Inventory reports
Show balances, movements, available, reserved, slow-moving, or near-expiry quantities.
Sales and profitability reports
Follow product and customer sales, collections, and margins from operational and financial data.


Explain the gap between planned material mix and actual output
Materials, quantities and operating stages
Start with the approved material list and mix, then link issues and returns to the order. Record stages, quantities, time, waste and quality outcomes so production-cost review follows actual movements.
Illustrative operating simulation
A hypothetical plastic-product order uses base material and additives against a planned bill of materials. If actual issues rise, the team reviews the cause, returns, waste and accepted output instead of assuming the difference is saleable production. This is an illustration, not a measured efficiency or savings claim.
What explains a cost difference?
Review order and unit cost and actual material use against plan, followed by time, waste and accepted quantities. Returns and rework treatment affect the review and are defined within the factory’s approved policy.
Is specialised mould management or PLC integration ready?
This page does not confirm specialised mould management or a direct machine-controller connection. These requirements need technical review to establish existing capabilities, configuration and any additional development.
Review the workflow, cost and activation plan
Operations and accounts system for plastic and rubber factories | Masna3y Pro
Track materials, mixes, and production orders, and know waste volume and the cost of every run.



